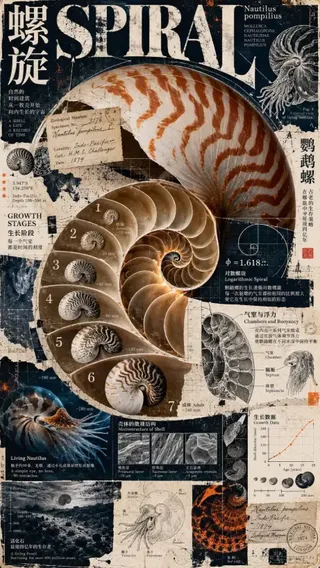
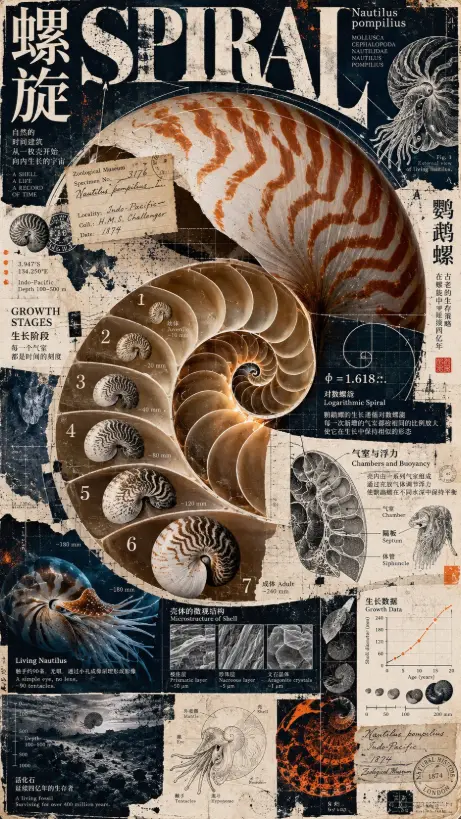
Scientific Research Data Visualization
A detailed scientific research data visualization featuring structured layouts, precise elements, and a clean modern palette.
【元素 A|研究对象】{OBJECT}(所属主题 {THEME};主标题 {TITLE_CN} / {TITLE_EN})
【元素 B|结构骨架】{SKELETON};排版规则:{RULE}
【元素 C|配色】{PALETTE}
【固定项】科学素材 {MATERIAL};画幅 9:16;原文的风格、节奏、质感、最终效果和禁止项不改
Recreate this image
- Aspect ratio
- 9:16
See how credits work
Three steps
- 1Copy the prompt above.
- 2Open the studio, pick GPT Image 2.5, and set the aspect ratio to 9:16.
- 3Generate, then iterate with reference images until it matches.
Start free · no credit card
More related